Understanding Your Heating Load Calculation Results
You have completed your heating load calculation according to DIN EN 12831 – but what do all the numbers actually mean? This article explains all results in detail: from the room overview to the annual heat demand to specific renovation suggestions.
Our heating load calculator provides not only the standard-compliant heating load but also practical additional information for planning your heating system.
Results Overview
After the calculation, you will first see a compact summary of all key figures:
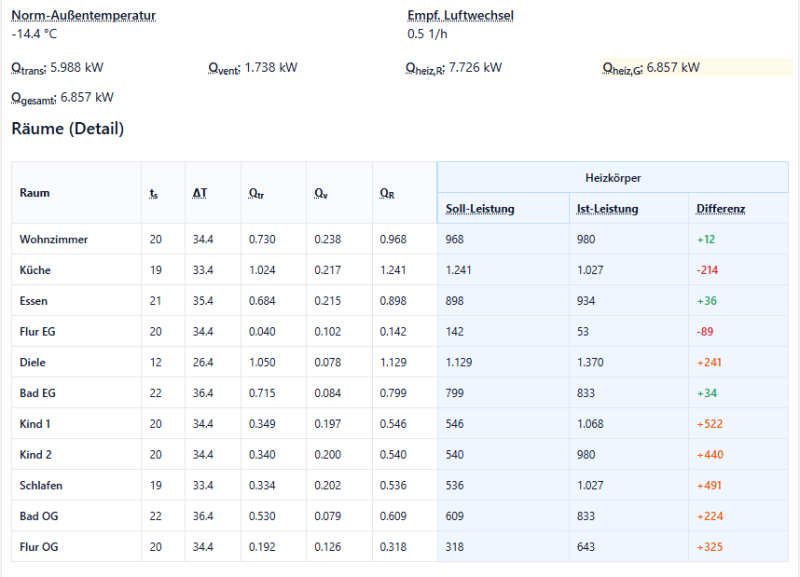 The results overview shows all rooms with their heating loads and radiator matching
The Most Important Key Figures at a Glance
| Key Figure | Symbol | Meaning |
|---|---|---|
| Design outdoor temperature | θe | Coldest expected day at the location |
| Qtrans | Transmission heat loss | Heat escaping through building components |
| Qvent | Ventilation heat loss | Heat lost through air exchange |
| Qheat,R | Room heating load (sum) | For radiator sizing (100% ventilation) |
| Qheat,G | Building heating load | For heat generator sizing |
Room Heating Load vs. Building Heating Load
An important difference that is often misunderstood:
| Heating Load Type | Calculation | Use |
|---|---|---|
| Room heating load | Transmission + 100% ventilation | Sizing radiators per room |
| Building heating load | Transmission + 50% ventilation | Sizing the heat generator |
Why the difference? For the building heating load, only 50% of the ventilation heat loss is applied because in practice not all rooms are ventilated simultaneously. The sum of room heating loads is therefore always higher than the building heating load.
Understanding the Room Table
For each room, the following values are displayed:
| Column | Meaning |
|---|---|
| ts | Target indoor temperature (e.g. 20°C for living rooms) |
| ΔT | Temperature difference (indoor minus outdoor temperature) |
| Qtr | Transmission heat loss of the room |
| QV | Ventilation heat loss of the room |
| QR | Total room heating load |
| Required output | Required radiator output |
| Actual output | Installed radiator output |
| Difference | Over/under-provision in watts |
The difference column shows at a glance whether your radiators are adequately sized:
- Green values (+): Radiator provides more than required
- Red values (-): Radiator is undersized
Detailed Results: Building Level
For deeper analysis, you can access the detailed results:
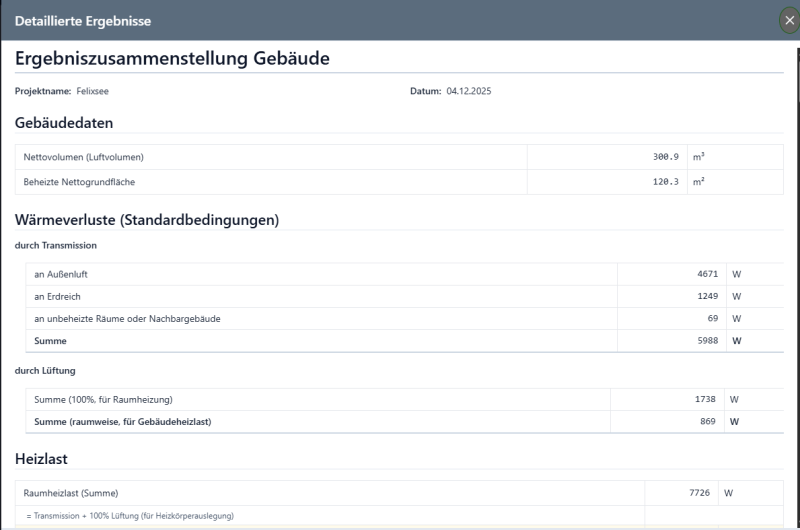 The building overview breaks down all heat losses by category
Building Data
| Key Figure | Meaning |
|---|---|
| Net volume | Heated air volume in m³ |
| Heated net floor area | Area of all heated rooms |
Heat Losses Through Transmission
Transmission heat losses are broken down by destination:
| Loss Path | Description | Typical Share |
|---|---|---|
| To outdoor air | Through external walls, windows, roof | 60–80% |
| To ground | Through floor slab, basement walls | 15–25% |
| To unheated rooms | To basement, attic, neighbours | 5–15% |
Heat Losses Through Ventilation
| Value | Meaning |
|---|---|
| Sum (100%) | For room heating/radiator sizing |
| Sum (room-by-room, 50%) | For building heating load/heat generator |
Detailed Results: Room Level
Each room can be analysed individually – with all building components and their heat losses:
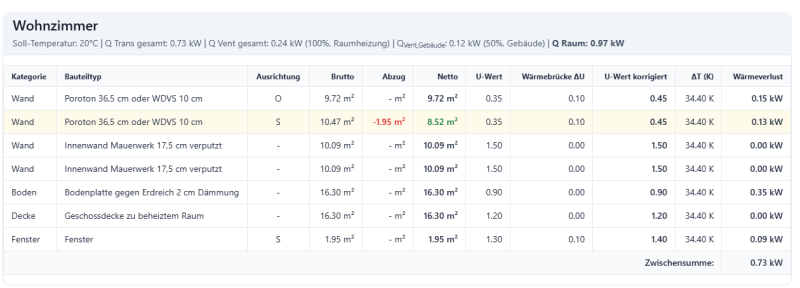 Component-by-component breakdown of heat losses in the living room
The Component Table in Detail
For each component, the following is displayed:
| Column | Explanation |
|---|---|
| Category | Wall, floor, ceiling, window, door |
| Component type | Specific construction from the catalogue |
| Orientation | Cardinal direction (N, E, S, W) or "-" for internal |
| Gross | Total area of the component |
| Deduction | Deduction areas (e.g. windows in wall) |
| Net | Effective area for calculation |
| U-value | Thermal transmittance in W/(m²·K) |
| Thermal bridge ΔU | Surcharge for thermal bridges |
| U-value corrected | U-value + ΔU |
| ΔT (K) | Temperature difference |
| Heat loss | Resulting loss in kW |
Interpreting U-Values
The U-value is the most important indicator for the insulation quality of a component:
| U-Value | Rating | Example |
|---|---|---|
| < 0.20 | Very good | Passive house wall |
| 0.20–0.30 | Good | New build to GEG standard |
| 0.30–0.50 | Adequate | Renovated old building |
| 0.50–1.00 | Moderate | Unrenovated old building |
| > 1.00 | Poor | Uninsulated external wall |
Tip: Red values in the table show negative deduction areas – this is correct and means that this area is subtracted from the gross area (e.g. window area from wall area).
Annual Heat Demand Progression
In addition to the design heating load (for the coldest day), our tool also calculates the annual heat demand – how much energy you actually need over the year:
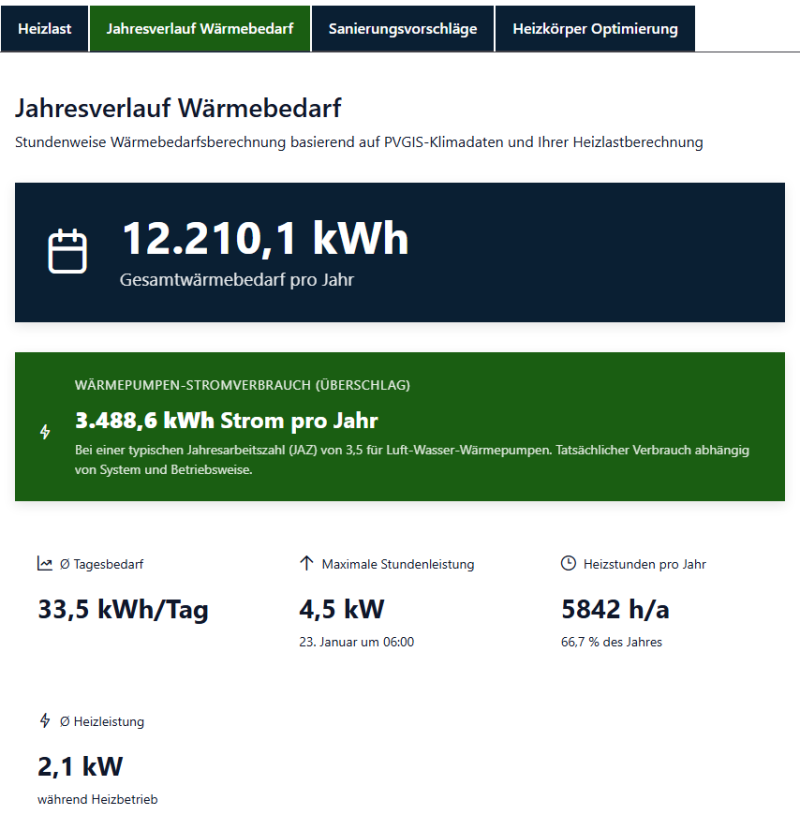 Annual heat demand and heat pump electricity consumption based on PVGIS climate data
The Most Important Annual Key Figures
| Key Figure | Meaning |
|---|---|
| Total heat demand | Annual sum in kWh/a |
| Heat pump electricity consumption | Estimate at typical SPF |
| Ø Daily demand | Average demand per day |
| Maximum hourly output | Peak load (corresponds approx. to design heating load) |
| Heating hours per year | Hours with heating demand |
| Ø Heating output | Average output during heating operation |
Note: The heat pump electricity consumption is an estimate based on a typical seasonal performance factor (SPF) of 3.5 for air-to-water heat pumps. Actual consumption depends on the system and operating mode.
Annual Progression Charts
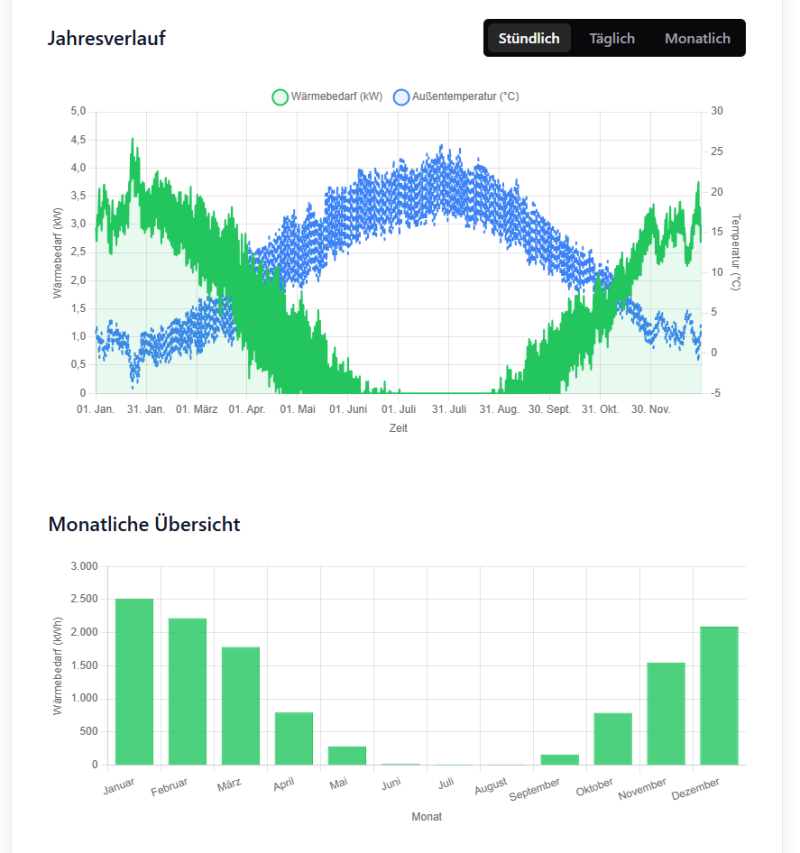 Hourly heat demand throughout the year and monthly distribution
The upper chart shows:
- Green area: Heat demand in kW
- Blue line: Outdoor temperature in °C
The lower chart shows the monthly distribution of heat demand:
- January/February: Highest demand
- June–August: Almost no heating demand
- Transition months: Variable demand
Why Is the Annual Heat Demand Important?
| Application | Benefit |
|---|---|
| Economic viability | Calculation of annual heating costs |
| Heat pump planning | Sizing and SPF estimation |
| Solar coupling | Determining the solar coverage rate |
| Comparison | Before/after comparison for renovations |
Renovation Suggestions
Based on your building components, our calculator automatically analyses the optimisation potential according to GEG 2024:
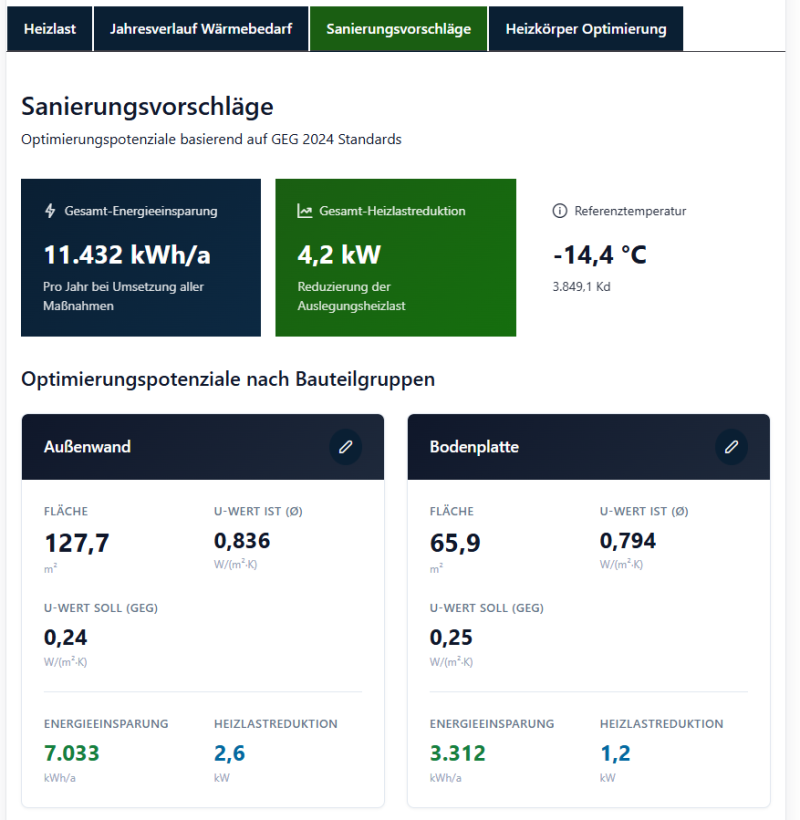 Automatic analysis of savings potential according to GEG standards
Overall Potential
| Key Figure | Meaning |
|---|---|
| Total energy savings | Possible annual savings in kWh |
| Total heating load reduction | Possible reduction of heating load in kW |
| Reference temperature | Design outdoor temperature at location |
Potential by Component Group
For each component group (external wall, roof, windows, floor slab), the analysis shows:
| Value | Description |
|---|---|
| Area | Total area of the component group |
| U-value ACTUAL (Ø) | Current average U-value |
| U-value TARGET (GEG) | GEG requirement for renovation |
| Energy savings | Annual savings with renovation |
| Heating load reduction | Reduction of design heating load |
Important: The renovation suggestions are based on GEG minimum requirements for component replacement. For comprehensive renovation, higher standards (e.g. KfW efficiency house) may also be sensible.
Typical Savings Potentials
| Measure | U-value before | U-value after | Savings |
|---|---|---|---|
| External wall insulation | 1.0 W/(m²·K) | 0.24 W/(m²·K) | 60–70% |
| Roof insulation | 0.8 W/(m²·K) | 0.20 W/(m²·K) | 70–75% |
| Window replacement | 2.8 W/(m²·K) | 1.10 W/(m²·K) | 55–65% |
| Basement ceiling insulation | 0.8 W/(m²·K) | 0.25 W/(m²·K) | 65–70% |
Radiator Optimisation
A particularly practical feature is the automatic radiator analysis:
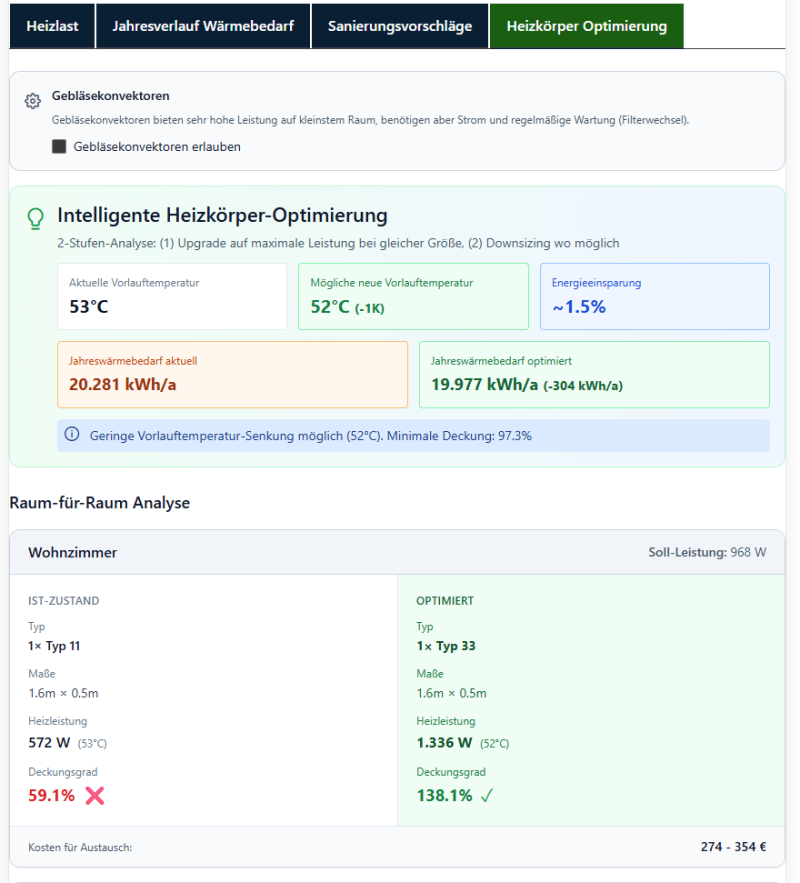 Intelligent radiator optimisation with specific replacement suggestions
The 2-Stage Analysis
Our algorithm checks two optimisation strategies:
- Upgrade to maximum output: Same dimensions, higher radiator type
- Downsizing where possible: Smaller radiator with over-provision
System-Wide Effects
| Key Figure | Meaning |
|---|---|
| Current flow temperature | Previous system temperature |
| Possible new flow temperature | Achievable after optimisation |
| Energy savings | Percentage savings |
| Annual heat demand current | Before optimisation |
| Annual heat demand optimised | After optimisation |
Why lower flow temperature? A lower flow temperature significantly improves the efficiency of heat pumps. Each degree less increases the SPF by approximately 2.5%.
Room-by-Room Analysis
For each room, the analysis shows:
| CURRENT STATE | OPTIMISED |
|---|---|
| Current radiator type | Recommended radiator type |
| Current dimensions | New dimensions (if changed) |
| Heat output at system temperature | New heat output |
| Coverage rate (< 100% = undersupplied) | New coverage rate (≥ 100%) |
The replacement costs provide a rough guide for the investment.
Understanding Coverage Rate
| Coverage Rate | Rating | Recommendation |
|---|---|---|
| < 80% | Critically undersupplied | Radiator replacement urgent |
| 80–99% | Slightly undersupplied | Replacement recommended |
| 100–120% | Optimal | No change needed |
| > 120% | Oversized | Downsizing possible |
What to Do with the Results?
For New Build or Heating System Replacement
- Size the heat generator: Use building heating load Qheat,G
- Size radiators: Room heating loads QR per room
- Plan buffer tank: Consider potential oversizing for heat pumps
For Renovation Planning
- Identify weak points: Components with high U-values
- Prioritise measures: Sort by savings potential
- Check economic viability: Savings vs. investment costs
- Use subsidies: KfW/BAFA programmes for energy renovation
For Radiator Problems
- Undersupplied rooms: Radiator replacement according to optimisation suggestion
- Lower flow temperature: If all rooms are oversupplied
- Hydraulic balancing: Carry out after optimisation
Conclusion
Core Message: The heating load calculation provides far more than just a single figure. The room heating load is used for radiator sizing, the building heating load for heat generator dimensioning. The annual heat demand enables economic viability calculations, the renovation suggestions show savings potentials, and the radiator optimisation helps prepare for low flow temperatures – important for efficient heat pump operation.
Try it now: Go to the Heating Load Calculator
Further Reading
Sources
- DIN EN 12831-1: Energy performance of buildings – Method for calculation of the design heat load
- GEG 2024: Building Energy Act
- VDI 6030: Designing room heating surfaces